At work we’ve been using New Relic, a popular software-as-a-service monitoring platform to monitor a number of our servers and applications.
Whilst I’m always hesitant of relying on external providers and prefer an open source solution where possible, the advantages provided by New Relic have been hard to ignore, good enough to drag me away from the old trusty realm of Munin.
Like many conventional monitoring tools (eg Munin), New Relic provides good coverage and monitoring of servers, including useful reports on I/O, networking and processes.
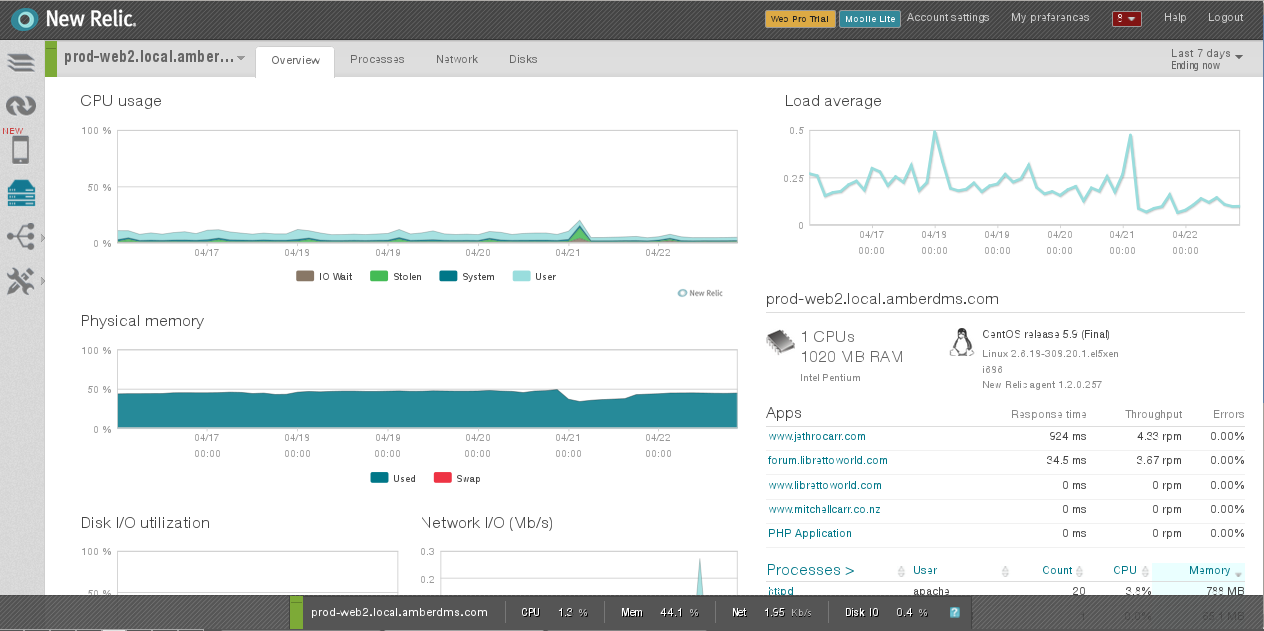
Bro, I’m relaxed as bro. (server monitoring with New Relic)
However where New Relic really provides value is with it’s monitoring of applications, thanks to a number of agents for various platforms including PHP, Ruby, Python, Java and .NET.
These agents hook into your applications and profile their performance in detail, showing details such as breakdown of latency by layer (DB, language, external, etc), slow DB queries and other detailed traces.
For example, I found that my blog was taking around 1,000ms of processing time in PHP when serving up page content. The VM itself had little load, but WordPress is just not a particularly well oiled application.
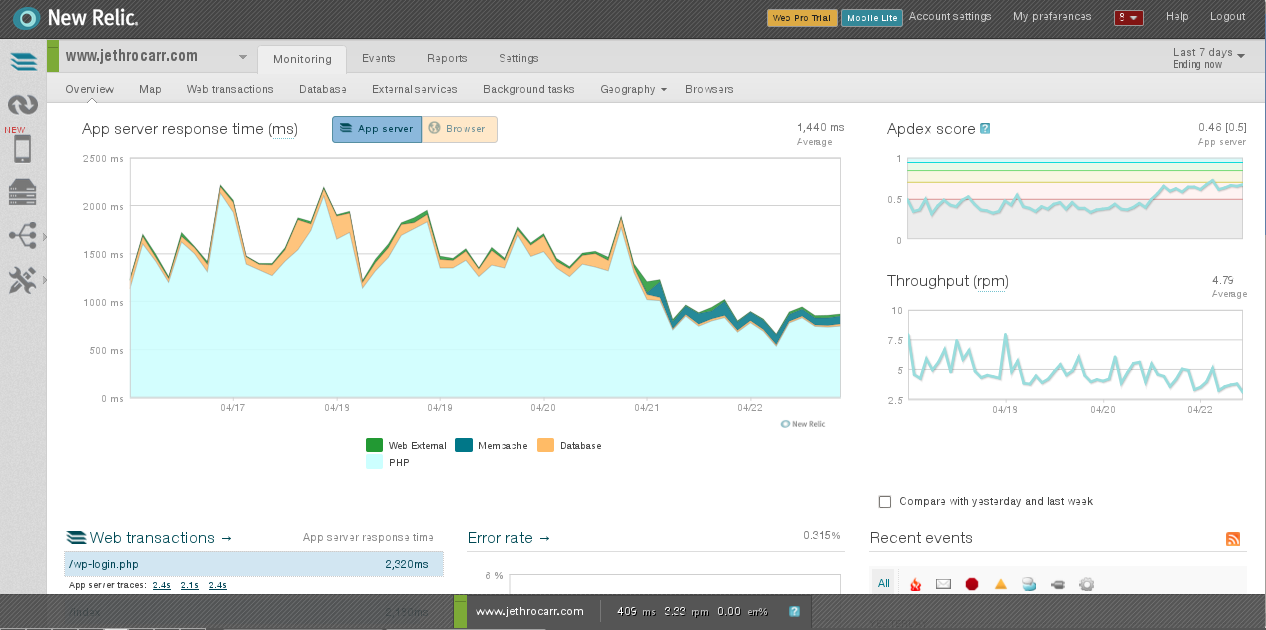
Before and after installing W3 Total Cache on my blog. Next up is to add Varnish and drop server times even further.
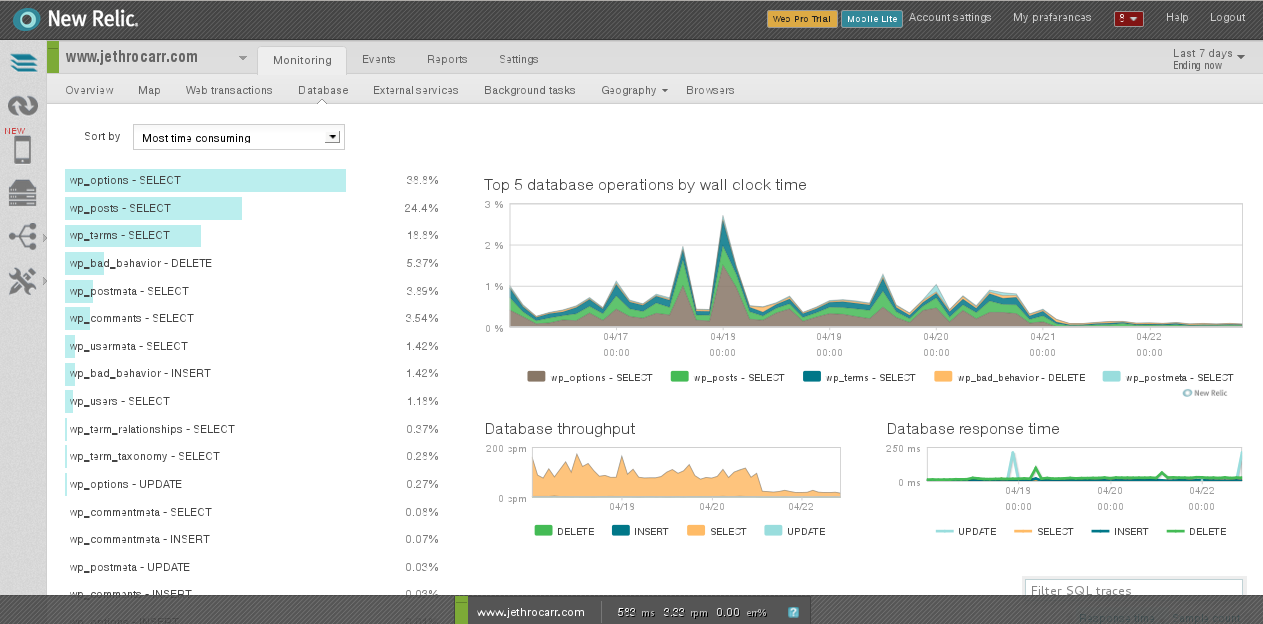
Toss out your crufty DBA, we have a new best friend! (just kidding DBAs, I still love ya)
New Relic will even slip an addition into the client-side content which measures the browser-side performance and experience for users visiting your website or application, allowing you to determine cause of slow page loads.
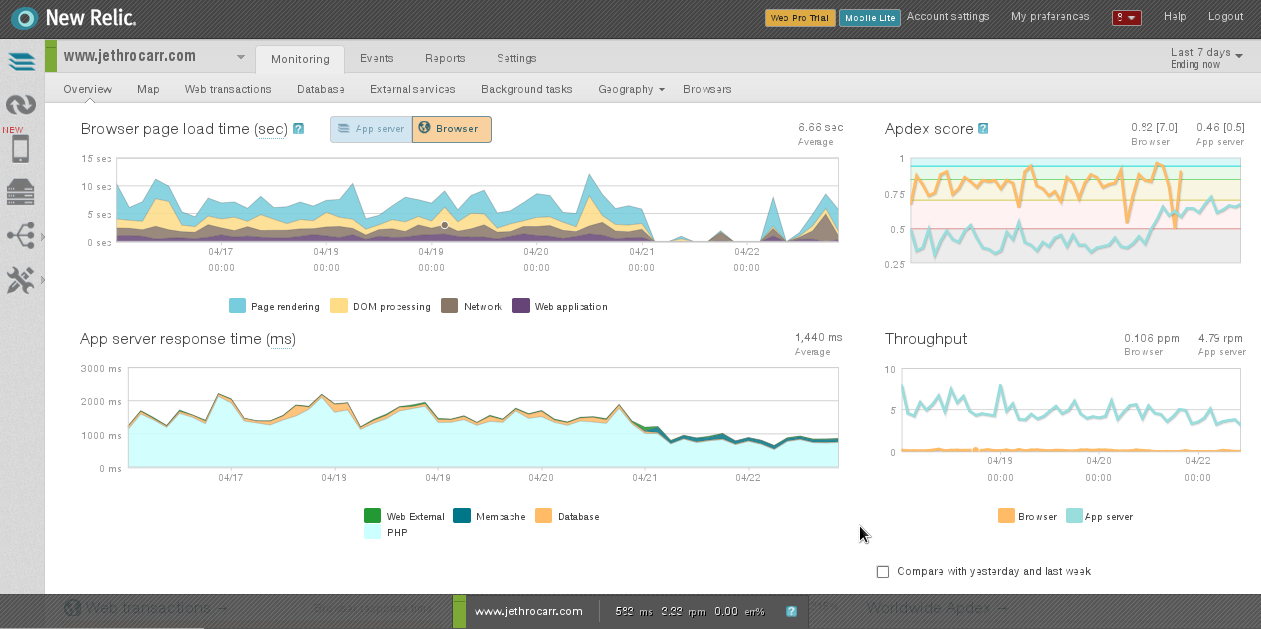
Generally my issue is too much large content + slow links
There’s plenty more offered, I haven’t even looked at all the options and features yet myself – best approach is to sign up for a free account and trial it for a while to see if it suits.
New Relic recently added a Mobile Application agent for iOS and Android developers, so it’s also attractive if you’re writing mobile applications and want to check how they’re performing on real user devices in the wild.
Installation of the server agent is simply a case of dropping a daemon onto the host (with numerous distribution packages available). The application agents vary depending on language, but are either a case of loading the agent with the application, or bundling a module into your application.
It scales well performance wise, we’ve installed the agent on some of AU’s largest websites with very little performance impact in most cases and the New Relic interface remains fast and responsive.
Only warning I’d make is that the agent uses HTTP by default, rather than HTTPS – whilst the security impact is somewhat limited as the data sent isn’t too confidential, I would really prefer the application use HTTPS-only. (There does appear to be an “enterprise security” mode which forces HTTPS agents only and adds other security options, so do some research if it’s a concern).
Pricing is expensive, particularly for the professional account package with the most profiling. Having said that, for a web company where performance is vital, New Relic can quickly pay for itself with reduced developer time spend on issues and fast alerting to performance related issues. Both operations and developers have found it valuable at work, and I’ve personally found this a much more useful tool than our Splunk account.
If you’re only interested in server monitoring you will probably find better value in a traditional Munin setup, unless you value the increased simplicity of configuration and maintenance.
Note that New Relic is also not a replacement for alert-monitoring such as Nagios – whilst New Relic can generate alerts for performance issues and other thresholds, my advice is to rely on Nagios for service and resource overload/failure and rely on New Relic monitoring for alerting to abnormal or negative performance trends.
I also found that I still find Awstats very useful – whilst New Relic has some nice browser stats and geography stats, Awstats is more useful for the “how much traffic and data has my website/application done this month” type questions.
It’s not for everyone’s requirements and budget, but I do highly recommend having an initial trial of it, whether you’re running a couple of servers or a massive enterprise.


