Monthly Archives: October 2013

SPF with SpamAssassin

I’ve been using SpamAssassin for years, it’s a fantastic open source anti-spam tool and plugs easily into *nix operating system mail transport agents such as Sendmail and Postfix.

To stop sender address forgery, where spammers email using my domain to email either myself, or others entities, I configured SPF records for my domain some time ago. The SPF records tell other mail servers which systems are really mine, vs which ones are frauds trying to send spam pretending to be me.

SpamAssassin has a plugin that makes use of these SPF records to score incoming mail – by having strict SPF records for my domain and turning on SpamAssassin’s validation, it ensures that any spam I receive pretending to be from my domain will be blocked, as well as anyone trying to spam under the name of other domains with SPF enabled will also be blocked.

Using SpamAssassin’s scoring offers some protection against false positives – if an organisation missconfigures their mail server so that their SPF record fails, but all the other details in the email are OK, the email may still be delivered, if the content looks like ham, comes from a properly configured server, etc, even if the SPF is incorrect – generally a couple different checks need to fail in order for emails to be blacklisted.

To turn this on, you just need to ensure your SpamAssassin configuration is set to load the SPF plugin:

loadplugin Mail::SpamAssassin::Plugin::SPF

You *also* need the Perl modules Mail::SPF or Mail::SPF::Query installed – without these, SpamAssassin will silently avoid doing SPF validations and you’ll be left wondering why you’re still getting silly spam.

On CentOS/RHEL, these Perl modules are available in EPEL and you can install both with:

yum install perl-Mail-SPF perl-Mail-SPF-Query

To check if SPF validation is taking place, check the mailserver logs or the X-Spam-Status email header for SPF_PASS (or maybe SPF_FAIL!), this proves the module is loaded and running correctly.

X-Spam-Status: No, score=-1.9 required=3.5 tests=AWL,BAYES_00,SPF_PASS,
 T_RP_MATCHES_RCVD autolearn=ham version=3.3.1

Finally sit back and enjoy the quieter, spam-free(ish) inbox :-)

Puppet CRL Time Errors

Puppet is much loved for it’s clear meaningful messages when something goes wrong, made even more delightful when you combine it with the lovely error messages thrown out by OpenSSL.

Warning: SSL_connect returned=1 errno=0 state=SSLv3 read server
certificate B: certificate verify failed: [CRL is not yet valid for
/CN=host.example.com]

This error indicates that the certificate is failing to validate since the clock between the node and the puppet master differs. In my case, the clock on the node was far behind the master due to a VirtualBox clock drift issue.

In this case, it was a simple case of re-syncing the clock to resolve the issue. However if the master had been generating certs with the clock far in the future, I would have needed to re-generate my node certificates entirely as the certs would also be incorrect.

Retro mode, engage!

Most followers of this blog will be following updates via RSS readers or automated Twitter postings, however I’ve had some requests to also offer email subscriptions for people who don’t make use of RSS readers or Twitter.

I’ve chucked up a receive-only Mailman mailing list which takes the RSS feed and sends out simple HTML emails when new posts are created, allowing you to read entirely in your mail client, or follow the link to the post itself.

Just click the “Mailing List” icon in the right-side column and enter your email address to receive updates.

Pick your poison

Pick your poison

I chose Mailman for this list since it handles bounce and membership handling very nicely, certainly better than a dodgy WordPress plugin is going to be able to do.

Hard drives can be bad influences on your RAID

RAID is designed to handle the loss of hard disks due to hardware failure and can ensure continual service during such a time. But hard drives are wonderful creatures and instead of dying quickly, they can often prolong their death with bad sectors, slow performance or other nasty issues.

In a RAID array if a disk fails in a clear defined fashion, the RAID array will mark it as failed and move on with it’s life. But if the disk is still functioning at reduced performance, write operations on the array will be slowed down to the speed of the slowest disk, as the write doesn’t return as complete until all disks have completed their operation.

It can be tricky to see gradual performance decreases in I/O performance until it reaches a truly terrible level of performance that it can’t go unnoticed due to impacting services in a clear and obvious fashion.

Thankfully tools like Munin make it much easier to see degrading performance over time. I was recently having I/O performance issues thanks to a failing disk and using Munin was quickly able to see which disk was responsible, as well as seeing the level of impact it was making on my system’s performance.

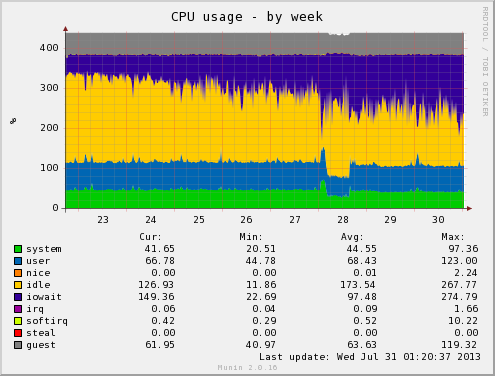
Got to love that I/O wait time!

Wasting almost 2 cores of CPU due to slow I/O holding up processes.

The CPU usage graph is actually very useful for checking out storage related problems, since it records the time spent with the CPU in an idle state due to waiting for storage to catch up and provide data required for operations.

This alone isn’t indicative of a fault – you could get similar results if you are loading your system with too many I/O intensive tasks and your storage just isn’t fast enough for your needs (Are hard disks ever fast enough?), plus disk encryption always imposed some noticeable amount of I/O wait; but it’s a good first place to look.

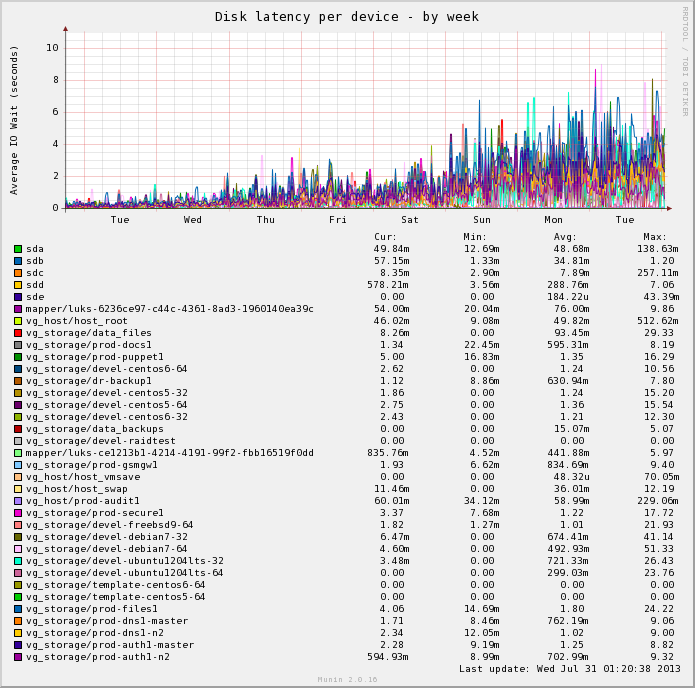
All the disks!

All the disks!

The disk latency graph is also extremely valuable and quickly shows the disk responsible. My particular example isn’t idle, since Munin has decided to pickup all my LVM volumes and include them on the graphs which makes it very unreadable.

Looking at the stats it’s easy to see that /dev/sdd is suffering, with an average latency of 288ms and a max peak of 7.06 *seconds*. Marking this disk as failed in the array instantly restored performance and I was then able to replace the disk and rebuild the array, restoring expected performance.

Note that this RAID array is built with consumer grade SATA disks, which are particularly bad for this kind of issue – an enterprise grade SATA disk would have been more likely to fail faster and more definitively, as they are designed primarily for RAID environments where the health of the array is more important than one disk doing everything possible to keep itself going.

In my case I’m using software RAID which makes it easy to see the statistics of each disk, since the controller is acting in a JBOD mode and exposing the disks directly to the OS. Using consumer disks like these could be much more “interesting” with a hardware RAID controller that wouldn’t expose the same amount of information… if using a hardware RAID controller, I’d advise to shell up the cash and use enterprise grade disks designed for RAID arrays or you could have a much more difficult life.